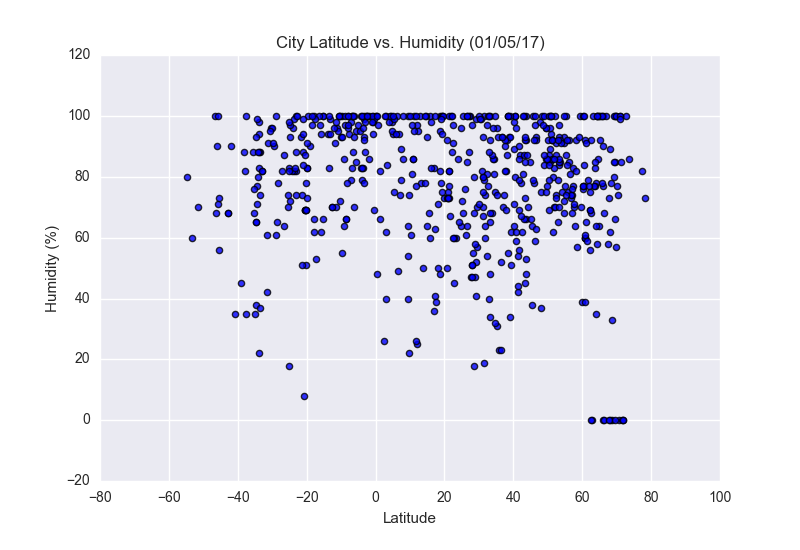
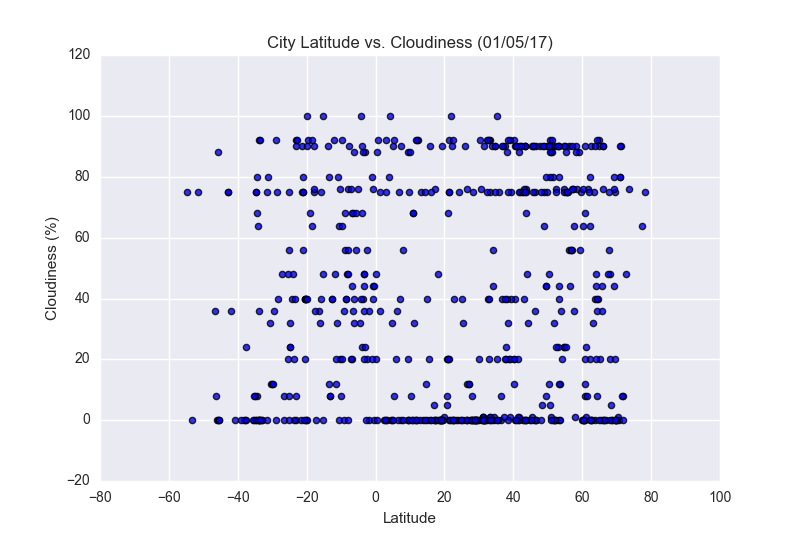
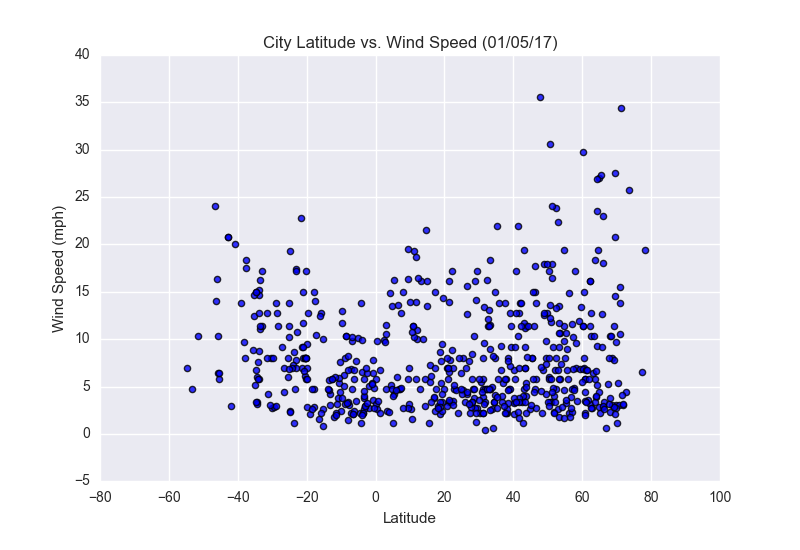
Summary: Latitude vs. X
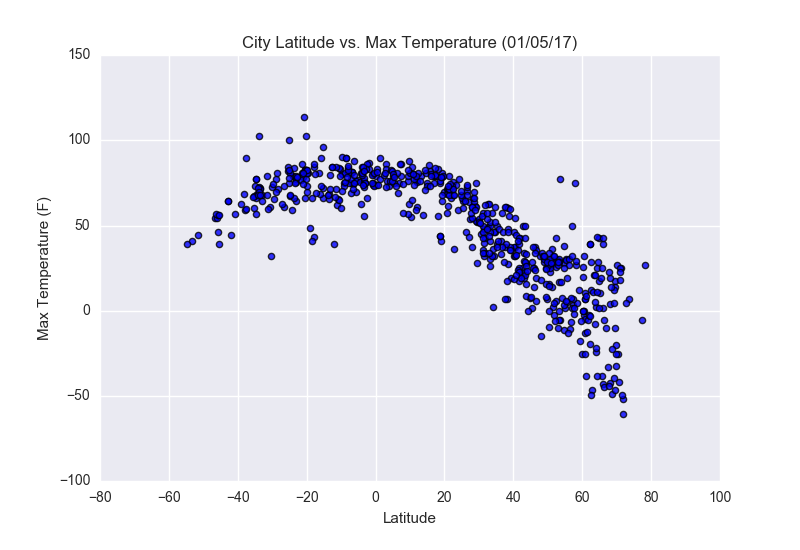
For this project we gathered weather data samples from over 500 cities using hte OpenWeatherMap API. We collected data to analyze how weather might change as you move closer to the equator.
Once the dataset was collected from the API it was stored in Data Frames using Pandas and then analyzed looking at factors like:
- Temperature
- Humidity
- Cloudiness
- Wind Speed
Visualizations